Slides and replay of my “Using R with Hadoop” webinar now available #rstats #hadoop

I owe a big “thank you” to all of you who attended my webinar yesterday “Using R with Hadoop”. Revolution Analytics partnered with us at Think Big Analytics to produce the webinar, and I owe them thanks as well.

For those of you who missed it, the slides and replay are now available from Revolution Analytics.


Posted in Tutorials. Tags: , . Leave a Comment »

Slides from “Tapping the Data Deluge with R” lightning talk #rstats #PAWCon

Here is my presentation from last night’s Boston Predictive Analytics Meetup graciously hosted by Predictive Analytics World Boston.

The talk is meant to provide an overview of (some) of the different ways to get data into R, especially supplementary data sets to assist with your analysis.

All code and data files are available at github: http://bit.ly/pawdata (https://github.com/jeffreybreen/talk-201210-data-deluge)

The slides themselves are on slideshare: http://bit.ly/pawdatadeck (http://www.slideshare.net/jeffreybreen/tapping-the-data-deluge-with-r)

Slides from today’s Big Data Step-by-Step Tutorials: Infrastructure series and Intro to R+Hadoop with RHadoop’s rmr

Here are my presentations from today’s Boston Predictive Analytics Big Data Workshop.

All code and config files are available at github: https://github.com/jeffreybreen/tutorial-201203-big-data

My portion of the workshop was divided into four parts, three focusing on different infrastructure scenarios and ending with a deep dive into the rmr R package:

Big Data Step-by-Step: Infrastructure 1/3: Local VM

    Starting small. Just because Big Data tools like Hadoop were designed to run at “web-scale,” across many nodes, doesn’t mean you need to build a cluster—or even dedicate a single machine—to get started. In this deck we download and install a virtual machine from Cloudera which comes complete with a functioning, single-node Hadoop installation. As long as you restrict the size of your data set appropriately, this is great way to become accustomed to Hadoop and its tools. We walk through running a Hadoop Streaming job to make sure everything works. We later use this same VM to spawn a Hadoop cluster in the cloud (see part 3).


Big Data Step-by-Step: Infrastructure 2/3: Running R and RStudio on EC2

Not everyone has Big Data. Some of us have an occasional need to analyze a data set larger than comfortably fits in our existing analysis environment either due to disk, CPU, or memory constraints. For these times, launching a single, large machine in the cloud may fit the bill. This part of presentation walks through how to launch just such a machine using Amazon’s EC2 cloud computing platform. Since I tend to run R and RStudio on Linux, that’s the focus of this tutorial, but the general outline may be helpful to others as well.


Big Data Step-by-Step: Infrastructure 3/3: Taking it to the cloud… easily… with Whirr

Scale up using the cloud. The Apache Whirr cloud management tool makes it easy to launch a Hadoop cluster on EC2. We use the Cloudera VM from presentation #1 as a launching point for the cluster and, thanks to a Whirr-generated proxy script, submit jobs and fetch results from our local VM just as before. For extra credit, we see how Whirr can save us money by bidding for excess capacity via EC2’s spot instances.


Big Data Step-by-Step: Using R & Hadoop (with RHadoop’s rmr package)

Crunching Big Data with R. Originally a Java-only ecosystem, Hadoop Streaming allows the creation of mappers, reducers, and combiners in any language which can handle stdin and stdout—but that doesn’t mean you want to have to write code to manage I/O at that level. After a quick (and undoubtedly incomplete) survey of Hadoop-related R packages, we walk through some of the abstractions and features of RHadoop’s rmr package which make it easier for R developers to get started. We walk through a sample mapper and reducer, demonstrating and documenting the native R objects which carry the data from step to step.


Thank you to the session’s sponsors, all the speakers, and to an interesting and engaged audience. Special thanks to John Versotek for arranging such an informative and enjoyable day, and for the opportunity to take part.

Use geom_rect() to add recession bars to your time series plots #rstats #ggplot

Zach Mayer’s work reproducing John Hussman’s Recession Warning Composite prompted me to dig this trick out of my (Evernote) notebook.

First, let’s grab some data to plot using the very handy getSymbols() function from Jeffrey Ryan’s quantmod package. We’ll load the U.S. unemployment rate (UNRATE) from the St. Loius Fed’s Federal Reserve Economic Data (src="FRED") and load the time series into a data.frame:

unrate = getSymbols('UNRATE',src='FRED', auto.assign=F) 
unrate.df = data.frame(date=time(unrate), coredata(unrate) )

Now FRED provides a USREC time series which we could use to draw the recessions. It’s a bit awkward, though, as it contains a boolean to flag recession months since January 1921. All we really want are the start and end dates of each recession. Fortunately, the St. Louis Fed publishes just such a table on their web site. (See the answer to “What dates are used for the US recession bars in FRED graphs?” on http://research.stlouisfed.org/fred2/help-faq/.) Sometimes it’s still easier to cut-and-paste (and the static table covers another 64 years, go figure):

recessions.df = read.table(textConnection(
"Peak, Trough
1857-06-01, 1858-12-01
1860-10-01, 1861-06-01
1865-04-01, 1867-12-01
1869-06-01, 1870-12-01
1873-10-01, 1879-03-01
1882-03-01, 1885-05-01
1887-03-01, 1888-04-01
1890-07-01, 1891-05-01
1893-01-01, 1894-06-01
1895-12-01, 1897-06-01
1899-06-01, 1900-12-01
1902-09-01, 1904-08-01
1907-05-01, 1908-06-01
1910-01-01, 1912-01-01
1913-01-01, 1914-12-01
1918-08-01, 1919-03-01
1920-01-01, 1921-07-01
1923-05-01, 1924-07-01
1926-10-01, 1927-11-01
1929-08-01, 1933-03-01
1937-05-01, 1938-06-01
1945-02-01, 1945-10-01
1948-11-01, 1949-10-01
1953-07-01, 1954-05-01
1957-08-01, 1958-04-01
1960-04-01, 1961-02-01
1969-12-01, 1970-11-01
1973-11-01, 1975-03-01
1980-01-01, 1980-07-01
1981-07-01, 1982-11-01
1990-07-01, 1991-03-01
2001-03-01, 2001-11-01
2007-12-01, 2009-06-01"), sep=',',
colClasses=c('Date', 'Date'), header=TRUE)

Now the only “gotcha” is that our recession data start long before our unemployment data, so let’s trim it to match:

recessions.trim = subset(recessions.df, Peak >= min(unrate.df$date) )

Finally, we use ggplot2’s geom_line() layer to draw the unemployment data and transparent (alpha=0.2) pink rectangles to overlay the recessions:

g = ggplot(unrate.df) + geom_line(aes(x=date, y=UNRATE)) + theme_bw()
g = g + geom_rect(data=recessions.trim, aes(xmin=Peak, xmax=Trough, ymin=-Inf, ymax=+Inf), fill='pink', alpha=0.2)

One-liners which make me love R: twitteR’s searchTwitter() #rstats

R reminds me a lot of English. It’s easy to get started, but very difficult to master. So for all those times I’ve spent… well, forever… trying to figure out the “R way” of doing something, I’m glad to share these quick wins.

My recent R tutorial on mining Twitter for consumer sentiment wouldn’t have been possible without Jeff Gentry’s amazing twitteR package (available on CRAN). It does so much of the behind-the-scenes heavy lifting to access Twitter’s REST APIs, that one line of code is all you need to perform a search and retrieve the (even paginated) results:

library(twitteR)

tweets = searchTwitter("#rstats", n=1500)

You can search for anything, of course, “#rstats” is just an example. (And if you’re really into that hashtag, the twitteR package even provides an Rtweets() function which hardcodes that search string for you.) The n=1500 specifies the maximum number of tweets supported by the Search API, though you may retrieve fewer as Twitter’s search indices contain only a couple of days’ tweets.

What you get back is a list of tweets (technically “status updates”):

> head(tweets)
[[1]]
[1] "Cloudnumberscom: CloudNumbers.com \023 #Rstats gets real in the cloud http://t.co/Vw4Gupr via @AddToAny"

[[2]]
[1] "0_h_r_1: CloudNumbers.com \023 #Rstats gets real in the cloud via DecisionStats - I came across Cloudnumbers.com . ... http://tinyurl.com/5sjagjg"

[[3]]
[1] "cmprsk: RT I just joined the beta to run #Rstats in the cloud with cloudnumbers.com http://t.co/lvVp0YJ via @cloudnumberscom http://bit.ly/lbSruR"

[[4]]
[1] "0_h_r_1: I just joined the beta to run #Rstats in the cloud with cloudnumbers.com http://t.co/lvVp0YJ via @cloudnumberscom"

[[5]]
[1] "cmprsk: RT man, the #rstats think people I am too soft on #sas, the #sas people think I am too soft on #wps, the #wps pe... http://bit.ly/innEv8"

[[6]]
[1] "keepstherainoff: Thanks to @cmprsk @geoffjentry and @MikeKSmith for colour-coded #Rstats GUI advice"

> class(tweets[[1]])
[1] "status"
attr(,"package")
[1] "twitteR"

Now that you have some tweets, the fun really begins. To get you started, the status class includes a very handy toDataFrame() accessor method (see ?status):

> library(plyr) 
> tweets.df = ldply(tweets, function(t) t$toDataFrame() )

> str(tweets.df)
'data.frame':	131 obs. of  10 variables:
 $ text        : Factor w/ 122 levels "CloudNumbers.com \023 #Rstats gets real in the cloud http://t.co/Vw4Gupr via @AddToAny",..: 1 2 3 4 5 6 7 8 9 10 ...
 $ favorited   : logi  NA NA NA NA NA NA ...
 $ replyToSN   : logi  NA NA NA NA NA NA ...
 $ created     : POSIXct, format: "2011-07-04 13:50:39" "2011-07-04 13:48:10" "2011-07-04 13:29:00" "2011-07-04 13:23:42" ...
 $ truncated   : logi  FALSE FALSE FALSE FALSE FALSE FALSE ...
 $ replyToSID  : logi  NA NA NA NA NA NA ...
 $ id          : Factor w/ 131 levels "87941406873751552",..: 1 2 3 4 5 6 7 8 9 10 ...
 $ replyToUID  : logi  NA NA NA NA NA NA ...
 $ statusSource: Factor w/ 17 levels "<a href="http://twitter.com/tweetbutton" rel="nofollow">Tweet Button</a>",..: 1 2 3 1 3 4 5 5 3 4 ...
 $ screenName  : Factor w/ 64 levels "Cloudnumberscom",..: 1 2 3 2 3 4 2 5 3 6 ...

You can pull a particular user’s tweets just as easily with the userTimeline() function. Heck, the package even lets you tweet from R if you use Jeff’s companion ROAuth package, but that requires more than one line….

Enjoy!

Posted in One-liners. Tags: , . 6 Comments »

One-liners which make me love R: Make your data dance (Hans Rosling style) with googleVis #rstats

It may be a cliché, but much of R’s utility comes from its amazing community. And by community, I am specifically referring to the bright, hard-working people who are willing to share their knowledge and code with the rest of us. Because of their contributions, we can do some amazingly cool and useful things with very little code of our own. It is in this context that I launch this new series to highlight packages and functions which make it easy to do jaw-droppingly cool and useful things.

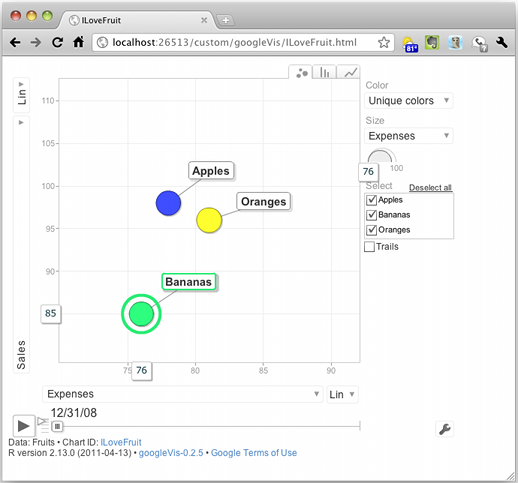
First up: the googleVis package by Markus Gesmann and Diego de Castillo which makes it easy — often with just one-line of R — to harness the Google Visualization API. Annotated timelines, gauges, maps, org charts, tree maps, and more are suddenly at your command.

I’m going to focus on the motion chart, popularized by Hans Rosling in his groundbreaking 2006 TED talk on global economic development. (If you haven’t seen it yet, you should. Right now. Seriously. Go.) Motion charts are an innovative way to display multidimensional time series in an interactive way. And the googleVis package even comes with some sample data to make it even easier to try them out.

The package is available from CRAN if you need to install it.

To get started, load the package and the included “Fruits” data.frame:

library(googleVis)
data(Fruits)

This data.frame contains some sample data about sales of various fruits at different locations for different years. There’s even a proper Date column already constructed for us from the numeric Year column:

To make the chart, we need to give the gvisMotionChart() function our data.frame and tell it a few things about it: the column which identifies the items to examine (idvar=Fruit), the time dimension (timevar=Date), and optionally a name to use to identify the chart in the generated HTML and JavaScript (we’ll use chartid="ILoveFruits"):

M = gvisMotionChart(data=Fruits, idvar="Fruit", timevar="Date", chartid="ILoveFruit")

That’s it.

You can view your chart with the overridden plot() function. It will automatically spawn a browser window and serve up your chart through R’s internal web server:

plot(M)

Since WordPress doesn’t allow embedded JavaScript, please click through to see the motion chart in action:

You can also access all 165 lines of the generated HTML and JavaScript and save it to disk:

cat(unlist(M$html), file="output/ILoveFruits.html")

Time suck alert: googleVis may make them easy to create, but motion charts can be a lot of fun to play with. You have been warned…

If you want to take a look at an example with some real data, you might be interested in the 20 Years of the U.S. Domestic Airline Market In 20 seconds post on my work blog.

Finally, here are the slides from my lightning talk on this topic at this month’s Greater Boston useR Group meeting:

Have fun!

installing R 2.13.1 on Amazon EC2’s “Amazon Linux” AMI #rstats

Condensed from this post (and comments) on David Chudzicki’s blog, tweaked, and updated for R-2.13.1.

Assumes you’re starting with a virgin “Amazon Linux” AMI. I picked “Basic 64-bit Amazon Linux AMI 2011.02.1 Beta” (AMI Id: ami-8e1fece7) because it was marked as free tier eligible on the “Quick Start” tab of AWS’s “Launch Instance” dialog box:

$ sudo yum -y install make libX11-devel.* libICE-devel.* libSM-devel.* libdmx-devel.* libx* xorg-x11* libFS* libX*  readline-devel gcc-gfortran gcc-c++ texinfo tetex

$ wget http://cran.r-project.org/src/base/R-2/R-2.13.1.tar.gz

$ tar zxf R-2.13.1.tar.gz && cd R-2.13.1
$ ./configure && make

$ # make coffee... or finish your PhD thesis... (yes, it takes that long)
[...]
$ # finally, if all is well:

$ sudo make install

$ cd
$ R --version
R version 2.13.1 (2011-07-08)
Copyright (C) 2011 The R Foundation for Statistical Computing
ISBN 3-900051-07-0
Platform: x86_64-unknown-linux-gnu (64-bit)

R is free software and comes with ABSOLUTELY NO WARRANTY.
You are welcome to redistribute it under the terms of the
GNU General Public License version 2.
For more information about these matters see
http://www.gnu.org/licenses/.

As always, refer to the Installation and Administration manual for details and options.

If you want to install RCurl, or anything which depends on it like twitteR, you’ll need to install libcurl & friends first:

$ sudo yum -y install libcurl libcurl-devel

slides from my R tutorial on Twitter text mining #rstats

Update: An expanded version of this tutorial will appear in the new Elsevier book Practical Text Mining and Statistical Analysis for Non-structured Text Data Applications by Gary Miner et. al which is now available for pre-order from Amazon.

In conjunction with the book, I have cleaned up the tutorial code and published it on github.


Last month I presented this introduction to R at the Boston Predictive Analytics MeetUp on Twitter Sentiment.

The goal of the presentation was to expose a first-time (but technically savvy) audience to working in R. The scenario we work through is to estimate the sentiment expressed in tweets about major U.S. airlines. Even with a tiny sample and a very crude algorithm (simply counting the number of positive vs. negative words), we find a believable result. We conclude by comparing our result with scores we scrape from the American Consumer Satisfaction Index web site.

Jeff Gentry’s twitteR package makes it easy to fetch the tweets. Also featured are the plyr, ggplot2, doBy, and XML packages. A real analysis would, no doubt, lean heavily on the tm text mining package for stemming, etc.

Here is the slimmed-down version of the slides:

And here’s a PDF version to download.

Special thanks to John Verostek for putting together such an interesting event, and for providing valuable feedback and help with these slides.


Update: thanks to eagle-eyed Carl Howe for noticing a slightly out-of-date version of the score.sentiment() function in the deck. Missing was handling for NA values from match(). The deck has been updated and the code is reproduced here for convenience:


score.sentiment = function(sentences, pos.words, neg.words, .progress='none')
{
	require(plyr)
	require(stringr)
	
	# we got a vector of sentences. plyr will handle a list
	# or a vector as an "l" for us
	# we want a simple array ("a") of scores back, so we use 
	# "l" + "a" + "ply" = "laply":
	scores = laply(sentences, function(sentence, pos.words, neg.words) {
		
		# clean up sentences with R's regex-driven global substitute, gsub():
		sentence = gsub('[[:punct:]]', '', sentence)
		sentence = gsub('[[:cntrl:]]', '', sentence)
		sentence = gsub('\\d+', '', sentence)
		# and convert to lower case:
		sentence = tolower(sentence)

		# split into words. str_split is in the stringr package
		word.list = str_split(sentence, '\\s+')
		# sometimes a list() is one level of hierarchy too much
		words = unlist(word.list)

		# compare our words to the dictionaries of positive & negative terms
		pos.matches = match(words, pos.words)
		neg.matches = match(words, neg.words)
	
		# match() returns the position of the matched term or NA
		# we just want a TRUE/FALSE:
		pos.matches = !is.na(pos.matches)
		neg.matches = !is.na(neg.matches)

		# and conveniently enough, TRUE/FALSE will be treated as 1/0 by sum():
		score = sum(pos.matches) - sum(neg.matches)

		return(score)
	}, pos.words, neg.words, .progress=.progress )

	scores.df = data.frame(score=scores, text=sentences)
	return(scores.df)
}

googleVis-0.2.4 requires older version of RJSONIO (0.5-0) #rstats

[Update: the new release of googleVis accounts for changes in RJSONIO’s handling of backslashes, so you probably won’t need the older version.]

Something has apparently changed in the way RJSON’s toJSON() function works which is causing all sorts of extra escape characters (backslashes) to appear in the googleVis-generated JavaScript, at least when trying to set a visualization’s initial state. This bogus code causes the browser’s JavaScript engine to choke just before it can call chart.draw(), so you don’t see the Flash visualization at all–just a blank space with the pretty footer.

This is at least the case on Mac OS 10.6.7 and Markus Gesmann gets all the credit for tracking it down.

Here’s an example state string which selects a couple of bubbles to be labeled (“Oranges” and “Apples”) and sets the time to start about half-way through:

state.json='{"xAxisOption":"3","xZoomedDataMin":81,"playDuration":15000,"sizeOption":"_UNISIZE","xZoomedDataMax":111,"xLambda":1,"dimensions":{"iconDimensions":["dim0"]},"yZoomedDataMax":91,"duration":{"multiplier":1,"timeUnit":"Y"},"orderedByX":false,"xZoomedIn":false,"yZoomedDataMin":71,"showTrails":false,"orderedByY":false,"iconType":"BUBBLE","uniColorForNonSelected":false,"yZoomedIn":false,"nonSelectedAlpha":0.4,"yLambda":1,"time":"2010","yAxisOption":"4","iconKeySettings":[{"LabelY":27,"key":{"dim0":"Apples"},"LabelX":42}],"colorOption":"6"}'

# create the motion chart
M=gvisMotionChart(Fruits, "Fruit", "Year", options=list(state=state.json))

Here’s the output in question using the current RJSONIO 0.7:

> cat(M$html$chart['jsDrawChart'])

// jsDrawChart
function drawChartMotionChartID6db280db() {
  var data = gvisDataMotionChartID6db280db()
  var chart = new google.visualization.MotionChart(
   document.getElementById('MotionChartID6db280db')
  );
  var options ={};
options["width"] = [    600 ];
options["height"] = [    500 ];
options["state"] = [ "{\\"xAxisOption\\":\\"3\\",\\"xZoomedDataMin\\":81,\\"playDuration\\":15000,\\"sizeOption\\":\\"_UNISIZE\\",\\"xZoomedDataMax\\":111,\\"xLambda\\":1,\\"dimensions\\":{\\"iconDimensions\\":[\\"dim0\\"]},\\"yZoomedDataMax\\":91,\\"duration\\":{\\"multiplier\\":1,\\"timeUnit\\":\\"Y\\"},\\"orderedByX\\":false,\\"xZoomedIn\\":false,\\"yZoomedDataMin\\":71,\\"showTrails\\":false,\\"orderedByY\\":false,\\"iconType\\":\\"BUBBLE\\",\\"uniColorForNonSelected\\":false,\\"yZoomedIn\\":false,\\"nonSelectedAlpha\\":0.4,\\"yLambda\\":1,\\"time\\":\\"2010\\",\\"yAxisOption\\":\\"4\\",\\"iconKeySettings\\":[{\\"LabelY\\":27,\\"key\\":{\\"dim0\\":\\"Apples\\"},\\"LabelX\\":42}],\\"colorOption\\":\\"6\\"}" ];
  chart.draw(data,options);
}

And here’s working code from RJSONIO 0.5:

> cat(M$html$chart['jsDrawChart'])

// jsDrawChart
function drawChartMotionChartID47a55df7() {
  var data = gvisDataMotionChartID47a55df7()
  var chart = new google.visualization.MotionChart(
   document.getElementById('MotionChartID47a55df7')
  );
  var options ={};
options["width"] =    600;
options["height"] =    500;
options["state"] = "{\"sizeOption\":\"5\",\"nonSelectedAlpha\":0.4,\"xLambda\":1,\"iconType\":\"BUBBLE\",\"yZoomedDataMax\":91,\"iconKeySettings\":[{\"LabelY\":-124,\"LabelX\":-160,\"key\":{\"dim0\":\"Oranges\"}},{\"LabelY\":53,\"LabelX\":37,\"key\":{\"dim0\":\"Apples\"}}],\"xZoomedIn\":false,\"orderedByX\":false,\"showTrails\":false,\"yZoomedIn\":false,\"yZoomedDataMin\":71,\"xZoomedDataMin\":81,\"orderedByY\":false,\"xAxisOption\":\"3\",\"yAxisOption\":\"4\",\"uniColorForNonSelected\":false,\"duration\":{\"timeUnit\":\"Y\",\"multiplier\":1},\"time\":\"2009\",\"yLambda\":1,\"xZoomedDataMax\":111,\"dimensions\":{\"iconDimensions\":[\"dim0\"]},\"colorOption\":\"2\",\"playDuration\":15000}";
  chart.draw(data,options);
}

Maybe this post can help others avoid the blank look I had on my face as I kept staring at a blank page in my browser.

quantmod makes it easy to watch silver prices crash in R #rstats

As if there hasn’t been enough going on this week, silver prices have fallen nearly $10 per ounce. That’s a reduction of over 20%. Jeffrey Ryan’s quantmod package makes it easy to download the latest prices from OANDA’s web site and plot the excitement.

The getSymbols() function is at the heart of quantmod’s data retrieval prowess, currently handling Yahoo! Finance, Google Finance, the St. Louis Fed’s FRED, and OANDA sites, in addition to MySQL databases and RData and CSV files.

First a word of warning: if you have a computer science background, you may cringe at the way getSymbols() returns data. Rather than returning the fetched data as the result of a function call, it populates your R session’s .GlobalEnv environment (or another one of your choosing via the env parameter) with xts and zoo objects containing your data. For example, if you ask for IBM’s stock prices via getSymbols("IBM"), you will find the data in a new “IBM” object in your .GlobalEnv. This behavior can be changed by setting auto.assign=F, but then you can only request one symbol at a time. But this is a minor nit about an incredibly useful package.

There’s even a wrapper function to help retrieve precious metal prices, and we will use this getMetals() function to retrieve the last year’s worth of prices for gold (XAU) and silver (XAG):

library(quantmod)
getMetals(c('XAU', 'XAG'), from=Sys.Date()-365)

Yup — that’s it. getMetals() lets us know it has created two new objects:

[1] "XAUUSD" "XAGUSD"

There were also few warning messages complaining about the last line in the downloaded file. I haven’t bothered to dig into it as the data seem fine, including today’s price:

> ls()
[1] "XAGUSD" "XAUUSD"

> head(XAGUSD)
           XAG.USD
2010-05-07 17.6600
2010-05-08 18.4600
2010-05-09 18.4320
2010-05-10 18.4336
2010-05-11 18.5400
2010-05-12 19.3300

> tail(XAGUSD)
           XAG.USD
2011-05-02 47.9850
2011-05-03 45.2373
2011-05-04 44.0238
2011-05-05 40.9171
2011-05-06 37.9939
2011-05-07 35.0598

And here’s how easy it is to use the package’s built-in graphing facilities:

chartSeries(XAUUSD, theme="white")

chartSeries(XAGUSD, theme="white")

Yup — that’s quite a shellacking for silver.

Now I tend to be a ggplot2 guy myself, and I have never actually worked with xts or zoo objects before, but it’s pretty easy to get them into a suitable data.frame:

silver = data.frame(XAGUSD)
silver$date = as.Date(rownames(silver))
colnames(silver)[1] = 'price'

library(ggplot2)
ggplot(data=silver, aes(x=date, y=price)) + geom_line() + theme_bw()