Use geom_rect() to add recession bars to your time series plots #rstats #ggplot

Zach Mayer’s work reproducing John Hussman’s Recession Warning Composite prompted me to dig this trick out of my (Evernote) notebook.

First, let’s grab some data to plot using the very handy getSymbols() function from Jeffrey Ryan’s quantmod package. We’ll load the U.S. unemployment rate (UNRATE) from the St. Loius Fed’s Federal Reserve Economic Data (src="FRED") and load the time series into a data.frame:

unrate = getSymbols('UNRATE',src='FRED', auto.assign=F) 
unrate.df = data.frame(date=time(unrate), coredata(unrate) )

Now FRED provides a USREC time series which we could use to draw the recessions. It’s a bit awkward, though, as it contains a boolean to flag recession months since January 1921. All we really want are the start and end dates of each recession. Fortunately, the St. Louis Fed publishes just such a table on their web site. (See the answer to “What dates are used for the US recession bars in FRED graphs?” on http://research.stlouisfed.org/fred2/help-faq/.) Sometimes it’s still easier to cut-and-paste (and the static table covers another 64 years, go figure):

recessions.df = read.table(textConnection(
"Peak, Trough
1857-06-01, 1858-12-01
1860-10-01, 1861-06-01
1865-04-01, 1867-12-01
1869-06-01, 1870-12-01
1873-10-01, 1879-03-01
1882-03-01, 1885-05-01
1887-03-01, 1888-04-01
1890-07-01, 1891-05-01
1893-01-01, 1894-06-01
1895-12-01, 1897-06-01
1899-06-01, 1900-12-01
1902-09-01, 1904-08-01
1907-05-01, 1908-06-01
1910-01-01, 1912-01-01
1913-01-01, 1914-12-01
1918-08-01, 1919-03-01
1920-01-01, 1921-07-01
1923-05-01, 1924-07-01
1926-10-01, 1927-11-01
1929-08-01, 1933-03-01
1937-05-01, 1938-06-01
1945-02-01, 1945-10-01
1948-11-01, 1949-10-01
1953-07-01, 1954-05-01
1957-08-01, 1958-04-01
1960-04-01, 1961-02-01
1969-12-01, 1970-11-01
1973-11-01, 1975-03-01
1980-01-01, 1980-07-01
1981-07-01, 1982-11-01
1990-07-01, 1991-03-01
2001-03-01, 2001-11-01
2007-12-01, 2009-06-01"), sep=',',
colClasses=c('Date', 'Date'), header=TRUE)

Now the only “gotcha” is that our recession data start long before our unemployment data, so let’s trim it to match:

recessions.trim = subset(recessions.df, Peak >= min(unrate.df$date) )

Finally, we use ggplot2’s geom_line() layer to draw the unemployment data and transparent (alpha=0.2) pink rectangles to overlay the recessions:

g = ggplot(unrate.df) + geom_line(aes(x=date, y=UNRATE)) + theme_bw()
g = g + geom_rect(data=recessions.trim, aes(xmin=Peak, xmax=Trough, ymin=-Inf, ymax=+Inf), fill='pink', alpha=0.2)

slides from my R tutorial on Twitter text mining #rstats

Update: An expanded version of this tutorial will appear in the new Elsevier book Practical Text Mining and Statistical Analysis for Non-structured Text Data Applications by Gary Miner et. al which is now available for pre-order from Amazon.

In conjunction with the book, I have cleaned up the tutorial code and published it on github.


Last month I presented this introduction to R at the Boston Predictive Analytics MeetUp on Twitter Sentiment.

The goal of the presentation was to expose a first-time (but technically savvy) audience to working in R. The scenario we work through is to estimate the sentiment expressed in tweets about major U.S. airlines. Even with a tiny sample and a very crude algorithm (simply counting the number of positive vs. negative words), we find a believable result. We conclude by comparing our result with scores we scrape from the American Consumer Satisfaction Index web site.

Jeff Gentry’s twitteR package makes it easy to fetch the tweets. Also featured are the plyr, ggplot2, doBy, and XML packages. A real analysis would, no doubt, lean heavily on the tm text mining package for stemming, etc.

Here is the slimmed-down version of the slides:

And here’s a PDF version to download.

Special thanks to John Verostek for putting together such an interesting event, and for providing valuable feedback and help with these slides.


Update: thanks to eagle-eyed Carl Howe for noticing a slightly out-of-date version of the score.sentiment() function in the deck. Missing was handling for NA values from match(). The deck has been updated and the code is reproduced here for convenience:


score.sentiment = function(sentences, pos.words, neg.words, .progress='none')
{
	require(plyr)
	require(stringr)
	
	# we got a vector of sentences. plyr will handle a list
	# or a vector as an "l" for us
	# we want a simple array ("a") of scores back, so we use 
	# "l" + "a" + "ply" = "laply":
	scores = laply(sentences, function(sentence, pos.words, neg.words) {
		
		# clean up sentences with R's regex-driven global substitute, gsub():
		sentence = gsub('[[:punct:]]', '', sentence)
		sentence = gsub('[[:cntrl:]]', '', sentence)
		sentence = gsub('\\d+', '', sentence)
		# and convert to lower case:
		sentence = tolower(sentence)

		# split into words. str_split is in the stringr package
		word.list = str_split(sentence, '\\s+')
		# sometimes a list() is one level of hierarchy too much
		words = unlist(word.list)

		# compare our words to the dictionaries of positive & negative terms
		pos.matches = match(words, pos.words)
		neg.matches = match(words, neg.words)
	
		# match() returns the position of the matched term or NA
		# we just want a TRUE/FALSE:
		pos.matches = !is.na(pos.matches)
		neg.matches = !is.na(neg.matches)

		# and conveniently enough, TRUE/FALSE will be treated as 1/0 by sum():
		score = sum(pos.matches) - sum(neg.matches)

		return(score)
	}, pos.words, neg.words, .progress=.progress )

	scores.df = data.frame(score=scores, text=sentences)
	return(scores.df)
}

My first R package: zipcode

You may know that I am a fan of the CivicSpace US ZIP Code Database compiled by Schuyler Erle of Mapping Hacks fame. It contains nearly 10,000 more records than the ZIP Code Tabulation Areas file from the U.S. Census Bureau upon which it is based, so a lot of work has gone into it.

I have been using the database a lot recently to correlate with survey respondents, so I have saved it as an R data.frame. Since others may find it useful, too, I have packaged it into the ‘zipcode’ package now available on CRAN.

One you load the package, the database is available in the ‘zipcode’ data.frame:

> library(zipcode)
> data(zipcode)

> nrow(zipcode)
[1] 43191

> head(zipcode)
    zip       city state latitude longitude timezone  dst
1 00210 Portsmouth    NH 43.00590  -71.0132       -5 TRUE
2 00211 Portsmouth    NH 43.00590  -71.0132       -5 TRUE
3 00212 Portsmouth    NH 43.00590  -71.0132       -5 TRUE
4 00213 Portsmouth    NH 43.00590  -71.0132       -5 TRUE
5 00214 Portsmouth    NH 43.00590  -71.0132       -5 TRUE
6 00215 Portsmouth    NH 43.00590  -71.0132       -5 TRUE

Note that the ‘zip’ column is a string, not an integer, in order to preserve leading zeroes — a sensitive topic for those of us in the Northeast… 🙂

The package also includes a clean.zipcodes() function to help clean up zip codes in your data. It strips off “ZIP+4” suffixes, attempts to restore missing leading zeroes, and replaces anything with non-digits (like non-U.S. postal codes) with NAs:

> library(zipcode)
> data(zipcode)

> somedata = data.frame(postal = c(2061, "02142", 2043, "20210", "2061-2203", "SW1P 3JX", "210", '02199-1880'))
> somedata
      postal
1       2061
2      02142
3       2043
4      20210
5  2061-2203
6   SW1P 3JX
7        210
8 02199-1880

> somedata$zip = clean.zipcodes(somedata$postal)
> somedata
      postal   zip
1       2061 02061
2      02142 02142
3       2043 02043
4      20210 20210
5  2061-2203 02061
6   SW1P 3JX  <NA>
7        210 00210
8 02199-1880 02199

> data(zipcode)
> somedata = merge(somedata, zipcode, by.x='zip', by.y='zip')
> somedata
    zip     postal       city state latitude longitude timezone  dst
1 00210        210 Portsmouth    NH 43.00590 -71.01320       -5 TRUE
2 02043       2043    Hingham    MA 42.22571 -70.88764       -5 TRUE
3 02061       2061    Norwell    MA 42.15243 -70.82050       -5 TRUE
4 02061  2061-2203    Norwell    MA 42.15243 -70.82050       -5 TRUE
5 02142      02142  Cambridge    MA 42.36230 -71.08412       -5 TRUE
6 02199 02199-1880     Boston    MA 42.34713 -71.08234       -5 TRUE
7 20210      20210 Washington    DC 38.89331 -77.01465       -5 TRUE

Now we wouldn’t be R users if we didn’t try to do something with data, even if it’s just a lookup table of zip codes. So let’s take a look at how they’re distributed by first digit:

library(zipcode)
library(ggplot2)

data(zipcode)
zipcode$region = substr(zipcode$zip, 1, 1)

g = ggplot(data=zipcode) + geom_point(aes(x=longitude, y=latitude, colour=region))

# simplify display and limit to the "lower 48"
g = g + theme_bw() + scale_x_continuous(limits = c(-125,-66), breaks = NA)
g = g + scale_y_continuous(limits = c(25,50), breaks = NA)

# don't need axis labels
g = g + labs(x=NULL, y=NULL)

If we make the points smaller, cities and interstates are clearly visible, at least once you leave the Northeast Megalopolis:

Incremental improvements to Nightlights mapping thanks to R-Bloggers

My recent post Nightlights: cool data, bad geocoding highlighted some of the geocoding challenges Steve Mosher has been finding as he works with this interesting “light pollution” data set.

It was also my first article reposted on Tal Galili’s fantastic R-Bloggers site which I have been following for a while. But even better than the surge of new visitors were the great comments and suggestions posted by members of the community. In this post, I’m going to walk through each suggestion to illustrate just how generous and helpful this community can be.

Our starting point is where we ended up in my first post, using ggplot2 to display the raster nightlights data and map overlay:

library(RCurl)
library(R.utils)
library(rgdal)
library(raster)

url_radianceCalibrated = "ftp://ftp.ngdc.noaa.gov/DMSP/web_data/x_rad_cal/rad_cal.tar"
calibratedLights = "rad_cal.tar"
hiResTif = "world_avg.tif"

download.file(url_radianceCalibrated,calibratedLights,mode="wb")
untar(calibratedLights)
gunzip( paste(hiResTif, '.gz', sep='') )

hiResLights = raster( hiResTif )

# Eastern Mass., Cape Cod & Islands:
e = extent(-71.5, -69.5, 41, 43)

r = crop(hiResLights,e)
p = rasterToPoints(r)
df = data.frame(p)
colnames(df) = c("lon", "lat", "dn")

g = ggplot( data=df) + geom_point(aes(x=lon, y=lat, color=dn) )
g = g + scale_colour_gradient(low="black", high="white", trans="sqrt")
g = g + theme_bw() + xlim(c(-71.5,-69.5)) + ylim(c(41,43))
g = g + opts( axis.text.x = theme_blank(), axis.text.y = theme_blank() )
g = g + borders("state", colour="yellow", alpha=0.5)

Note the mismatch between the data and map overlay and the weirdness in the map where points are missing on the North Shore:

original data, positioning, and borders in ggplot2

Ben Bolker suggested a way to eliminate the artifacts which led me to this discussion on R-sig-Geo between Hadley Wickham and Paul Hiemstra which tipped me off to the existence of geom_path layer in addition to the geom_polygon layer which borders() usually produces. Polygons are closed but paths need not be, so that helps. And ggplot2’s map_data() function seems to grab the same data as borders():

b = map_data("state")

g = ggplot( data=df) + geom_point(aes(x=lon, y=lat, color=dn) )
g = g + scale_colour_gradient(low="black", high="white", trans="sqrt")
g = g + theme_bw() + xlim(c(-71.5,-69.5)) + ylim(c(41,43))
g = g + opts( axis.text.x = theme_blank(), axis.text.y = theme_blank() )
g = g + geom_path(data=b, aes(x=long,y=lat,group=group), colour="yellow", alpha=0.5)

Bonus: geom_path() obeys the “alpha=0.5” directive to set the transparency:

Worst artifacts solved by switching to map_data() and geom_path()

But Robert Hijmans really hit it out the park with two great suggestions. First, he pointed me towards a much, much better source of coastline data by using raster’s getData() function to grab data from the GADM database of Global Administrative Areas:

usa = getData('GADM', country="USA", level=0)

Level 0 will get you country boundaries, Level 1 for state/province, and so on. So we’ll lose state boundaries, but these files are pretty big to start with and can take a lot longer to plot.

Also, be warned: apparently somebody sinned against The Church of GNU, so you may need to run gpclibPermit() manually before running fortify() on the SpatialPolygonsDataFrame:

> f_usa = fortify(usa)
Using GADMID to define regions.

	Note: polygon geometry computations in maptools
 	depend on the package gpclib, which has a
 	restricted licence. It is disabled by default;
 	to enable gpclib, type gpclibPermit()

Checking rgeos availability as gpclib substitute:
FALSE 
Error: isTRUE(gpclibPermitStatus()) is not TRUE
> gpclibPermit()
[1] TRUE

With that hoop cleared, we can fortify() and plot this new layer:

f_usa = fortify(usa)

g = ggplot( data=df) + geom_point(aes(x=lon, y=lat, color=dn) )
g = g + scale_colour_gradient(low="black", high="white", trans="sqrt")
g = g + theme_bw() + xlim(c(-71.5,-69.5)) + ylim(c(41,43))
g = g + opts( axis.text.x = theme_blank(), axis.text.y = theme_blank() )
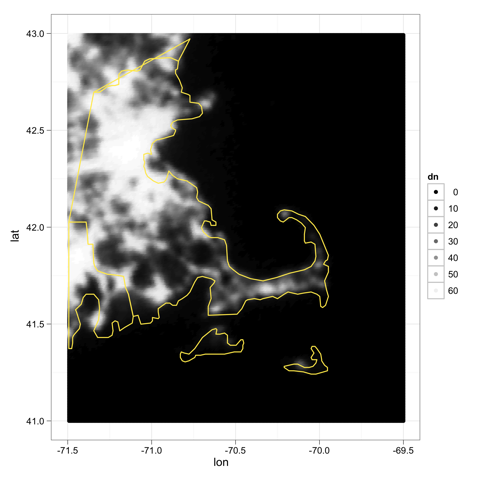
g = g + geom_path(data=f_usa, aes(x=long,y=lat,group=group), colour="yellow", alpha=0.5)

The coordinates are still shifted, but—wow—what a beautiful coast line. Cape Ann on the North Shore is really there now:

beautiful coastline data from GADM

Robert also points out an important mismatch in that GDAL returns the top left corner and resolution, so we could be off by a pixel or so. A quick call to xmax() and ymax() will fix this in our original raster:

xmax(hiResLights) = 180
ymin(hiResLights) = -90

r = crop(hiResLights,e)
p = rasterToPoints(r)
df = data.frame(p)
colnames(df) = c("lon", "lat", "dn")

g = ggplot( data=df) + geom_point(aes(x=lon, y=lat, color=dn) )
g = g + scale_colour_gradient(low="black", high="white", trans="sqrt")
g = g + theme_bw() + xlim(c(-71.5,-69.5)) + ylim(c(41,43))
g = g + opts( axis.text.x = theme_blank(), axis.text.y = theme_blank() )
g = g + geom_path(data=f_usa, aes(x=long,y=lat,group=group), colour="yellow", alpha=0.5)

Hey, that’s not bad at all:

final try, after adjusting GDAL pixel shift

Looking at the final version leads me to wonder how much of the geocoding problem is position, and how much is resolution/blurring/smearing. The lights of Provincetown, for instance, look pretty good. Maybe the blob is too north by a few pixels, but at least it’s well contained by land now. On Nantucket, the blur is half in the harbor. Then again, on Nantucket, most of the lights are right on the harbor, from the ferry terminal and running east to main street. So the lights are just about where they should be. Perhaps they’re just blurred and therefore spill into the harbor?

But the real point of the post is to highlight the generosity of this community. For that, thanks. And again: welcome R-Bloggers readers!

Nightlights: cool data, bad geocoding

A global source of population density has been on my low-priority wish list for some time, so I was very excited when I found Steve Mosher’s work with the Nighlights data set. “Nightlights” refers to the artificial lights seen from space at night. Astronomers call it “light pollution” which is pretty accurate since it’s decidedly not the light which we all use to see and avoid peril at night. Rather, it’s the light (and energy) wasted in that pursuit by being emitted or reflected straight up into the sky.

Steve has since spent some quality time with other R packages like Rgooglemap exploring this data set and has noticed some problems with the geocoding of the nightlights data.  I noticed the same thing, though much more naively, just trying to check out the data around my home:

library(RCurl)
library(R.utils)
library(rgdal)
library(raster)

url_radianceCalibrated = "ftp://ftp.ngdc.noaa.gov/DMSP/web_data/x_rad_cal/rad_cal.tar"
calibratedLights = "rad_cal.tar"
hiResTif = "world_avg.tif"

download.file(url_radianceCalibrated,calibratedLights,mode="wb")
untar(calibratedLights)
gunzip(paste(hiResTif, '.gz', sep='')

hiResLights = raster("world_avg.tif")

# Eastern Mass., Cape Cod & Islands:
e = extent(-71.5, -69.5, 41, 43)

r = crop(hiResLights,e)
plot(r)

which looks amazing… right up until you overlay the county boundaries from the standard ‘maps’ package:

library(maps)
map("county",xlim=c(-71.5,-69.5),ylim=c(41,43),add=T)

Alas. To my eye, there’s a clear shift to the northwest (see Provincetown at the tip of Cape Cod), and perhaps a bit of a clockwise rotation as well (see the big bulge of Cape Ann north of Boston).

Newer = better… ?

I have a lot to learn about this data, but in my poking around, I did find more recent observations available on a “Version 4 DMSP-OLS Nighttime Lights Time Series” page. But warning — these files are big. The tar file I download next is over 350MB:

url = "http://www.ngdc.noaa.gov/dmsp/data/web_data/v4composites/F152007.v4.tar"
dest = "F152007.v4.tar"
tif = "F152007.v4b_web.stable_lights.avg_vis.tif"

download.file(url, dest)
untar(dest)
gunzip( paste(tif, '.gz', sep='') )

f15 = raster(tif)
e = extent(-71.5, -69.5, 41, 43)
r = crop(f15, e)
plot(r)
map("county",xlim=c(-71.5,-69.5),ylim=c(41,43),add=T)

which looks a lot better, though still probably not perfect.

ggplot2 with raster

I am a huge fan of ggplot2, but since this was my first exposure to the raster package, I just copied and pasted Steve’s code to make the plots. But I couldn’t help myself to try to reproduce them in ggplot2.

Getting your data into a data.frame is the key to using ggplot2. Fortunately, the raster package includes a rasterToPoints() function which outputs a list which is easily cast to a data.frame:

p = rasterToPoints(r)
df = data.frame(p)
colnames(df) = c("lon", "lat", "dn")

which makes the actual plotting so easy, even qplot() will do it:

library(ggplot2)
qplot(lon, lat, color=dn, data=df) 
  + scale_colour_gradient(low="black", high='white', transform='sqrt') 
  + theme_bw() + borders("state", colour="yellow") 
  + xlim(c(-71.5, -69.5)) + ylim(c(41, 43))

The only technical glitch is in the overlay, as zooming in truncates the northernmost coastline points but the geom_polygon() layer created by borders() seems compelled to close the shape and connects the northern Mass. coast with Rhode Island.